

Our daily lives are increasingly multimodal when it comes to how we get around. How might we shape our Census to better track how we are mixing and matching our transportation choices?
This past weekend I sat down at our kitchen table and discovered that I had come out ahead in two uniquely Canadian games of chance*:
- Against all odds, I have now taken the lead in an NHL hockey playoff pool. (?!!)
- Our family was randomly selected to be among the one in four Canadian households filling in the long form version of Statistics Canada’s 2016 Census. (!!!!)
For those who may be tuning in from elsewhere, the Census is a big deal here in Canada, the self-said home of “peace, order and good government.” Much of the commentary on election night last October centered not just on the change in government but its corresponding impact on how we count our people.
“The long form census is back, baby!” trumpeted many an ecstatic tweet that election evening from those who work with cities and communities. They were referring to the newly-elected Liberal party’s promise to bring back the mandatory long form census, thereby undoing the previous government’s replacement of it in 2011 by an ill-regarded voluntary National Household Survey.
The long form version of the census is key because it compliments the short form questions that everyone gets and delves deeper into topics like employment, abilities, health, language, housing, education and transportation. This detailed data helps track progress on how our communities are changing and shapes future policy decisions to try to improve them.
So if you got a long form census this year, let me say THANK YOU for filling it in and know that the extra time that you took to do so helps move your community forward in multiple ways. You are creating an information feast for this and future generations.
AND just like a single bite at any feast, there are elements to this one that leave me hankering for more. Here’s why.
Mmmmm, Journey to Work Stats…

Image from the Statistics Canada website promotes filling in the census…and living a sustainable multimodal transportation lifestyle. (Source: Statistics Canada)
The resulting census data creates a banquet of information all right and for transportation planners such as myself there is no better treat than the part of the long form known as the “Journey to Work” section. The questions in this section include information on when and where people are working, what type of transportation they used to get there, their commuting time, and if they shared the ride with others if they went by car. (I’m paraphrasing; for exact details see either the 2011 National Household Survey Journey to Work Reference Guide or the 2016 Long Form Census questions).
Other than tracking how commute times and locations are shifting, a key stat that comes out of the Journey to Work info is the “mode share” for different areas or the percentage of people using each type of transportation. Looking at the percentage of people reporting that they drove themselves to work in a car, truck or van gives a sense of how auto-dependent a particular community is. Over time, it also provides an indication of whether those transportation trends are changing, hopefully in response to better land use or investment in things like transit or cycling and pedestrian infrastructure.
From a transportation planning perspective, the journey to work data can also provide insight into where people are travelling and in what direction the biggest travel flows are happening between areas.
Yes, indeed, there are few things more delicious to a city planning Riot Nrrrd than a nice helping of fresh transportation Journey to Work stats.
BUT, tasty as they are, every census I also find myself with a yearning for more detail that isn’t being captured.
Can I have my cake and more detail, too?
You see, a pivotal question in the journey to work section asks “How did this person usually get to work?” and then clarifies “If this person used more than one method of travel to work, select the one used for most of the travel distance.” So this means that respondents need to pick just one method of travel.
I think this question format was perhaps more useful in a past time where travel choices and employment were more static: “I’m a driver, that’s my main way of getting around and I’ve been driving to work (or cycling or taking the subway) everyday to the same job since 1982.” And for a segment of the population, the day in day out nature of the same travel every day is likely still the case.
However, as more of us are electing to live in the denser cores of communities and trade car use for a variety of active modes of travel, this question doesn’t really capture what’s really going on. For instance, check out what I reported to Statistics Canada through this census question versus what I actually did last week: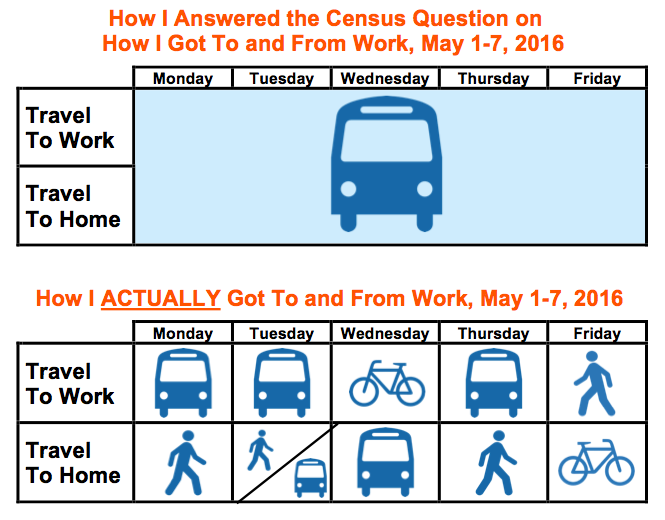
In fact, if I hadn’t stopped to pick up a lot of groceries on the way home on Tuesday and hopped a bus for the last half of my journey, the number of commutes that week by walking and transit would have been the same. And THEN what would my census answer have been?
In my chart I’m also ignoring all of the other mixing that’s going on, that I didn’t magically teleport from my house to a bus stop but walked there, and that my biking days also included walking kids to or from school part way.
Similarly, the census goes to notable lengths to categorize and break down the type of transit travel used (“Subway or elevated rail,” “Light rail, streetcar or commuter train,” “Bus”) but the focus on choosing “one” method of primary travel means that we’re not learning anything about how people are accessing those higher orders of transit. Did they walk or bike to the subway? Use their car or bus to connect to the commuter rail station?
And of course the census question is also not (yet) making reference to taxi, car share or other forms of shared mobility that are emerging.
I think raising this point about the census mobility questions is important because we are about to kick our national investment in sustainable transportation into high gear. We need to evolve the questions we ask about transportation not only because our cities and lifestyles are already changing but also to track the impacts of that investment.
I know that there is always a fine balance in surveys between legibility, number of questions and ensuring that there is continuity between survey years so that you can examine trend. But I wonder if there is a way to add to the existing questions by one or two more that would allow us to get a better sense of the detail and mixing of mobility that may be occurring. Even asking just one follow up question would be helpful: “If this person used more than one method of travel to work, what was the second type most commonly used?”
Of course the census isn’t the only way to get this kind of mobility data. Many individual regions and municipalities undertake Household Travel Surveys on a regular basis where a sample of the population is asked to record exactly when, where and how they travelled for a specified period of time. These surveys are far more detailed since they cover all trip types (i.e. not just commuting to work) and because they break trips into their multiple pieces.
However, the downside to these regional or local surveys is that they are expensive to undertake, vary from place to place and not all communities do them. One idea suggested by my transit planning colleague Maria Lockley was whether it would be worthwhile for the federal government to provide some portion of funding and guidance towards these regional travel surveys. Doing so would help ensure more uniformity to the questions and that they were undertaken regularly and would also provide a means for comparing across cities and evaluating their transportation investments.
That may be a good solution to consistently filling in the mobility detail missing from the census.
However, the beauty of the census data is that it gives a reliable snapshot across all jurisdictions on how people are getting around and so I’d still love to see a bit more detail there as well.
So, as an army of Statistics Canada staff spread out across the country this week to ensure that people take a moment to count themselves in, let me say that the long form Census is a great thing and I’m pleased to have it back (and was honoured to get to fill one in).
And as we wait for all that awesome data to arrive, I hope we can also take the next five years to think about how we can continue to evolve it to even more accurately capture how our communities are moving. Those of us in transportation are trying to build a suite of mobility options that work well together; I can do my job that much better the more I can see and understand how this banquet of options are being combined.
*All kidding aside, of course one sizable thing also on my mind this past week have been the folks up in Fort McMurray, as well as those in other communities in the Cariboo and Peace regions affected by fires. My thoughts are with them and if you haven’t already been there, donations to the Canadian Red Cross can be made here.
A decade of well scripted and well funded household travel surveys has led to quality reports like the recently produced Queensland Transport “How Queensland Travels report.” http://www.tmr.qld.gov.au/Community-and-environment/Research-and-education/Queensland-Household-Travel-Survey-summary-reports.aspx. This report provides a wealth of information for all types of Strategic Planning and more importantly Passenger Transport action plans across the region, helping not just the larger centers but the smaller rural centers also.
Nice! Juicy transport data in action. Thanks so much for sharing the link.